In our upcoming paper, we further develop techniques to make realistic line intensity mapping (LIM) simulations using empirical galaxy catalogue data for observations from the Fred Young Submm Telescope (FYST). LIM provides aggregate signal from a wide beam measured over an expansive sky map area, capturing information from dim galaxies which we cannot otherwise resolve at high redshift (the epoch of reionisation, EoR, 6 < z < 20, ~13 billion years ago). Our simulations must therefore accurately incorporate the primary target line emission, the star-formation tracer [CII] 158µm at the end of the epoch of reionisation (3.5 < z[CII] < 8.2 for FYST’s 210-420GHz range), as well as the foreground CO and [CI] contaminant signal (0 < z < 6). Correspondingly, it is imperative to ensure that the catalogues forming our mock tomographic maps have appropriate completeness across the entire redshift range.
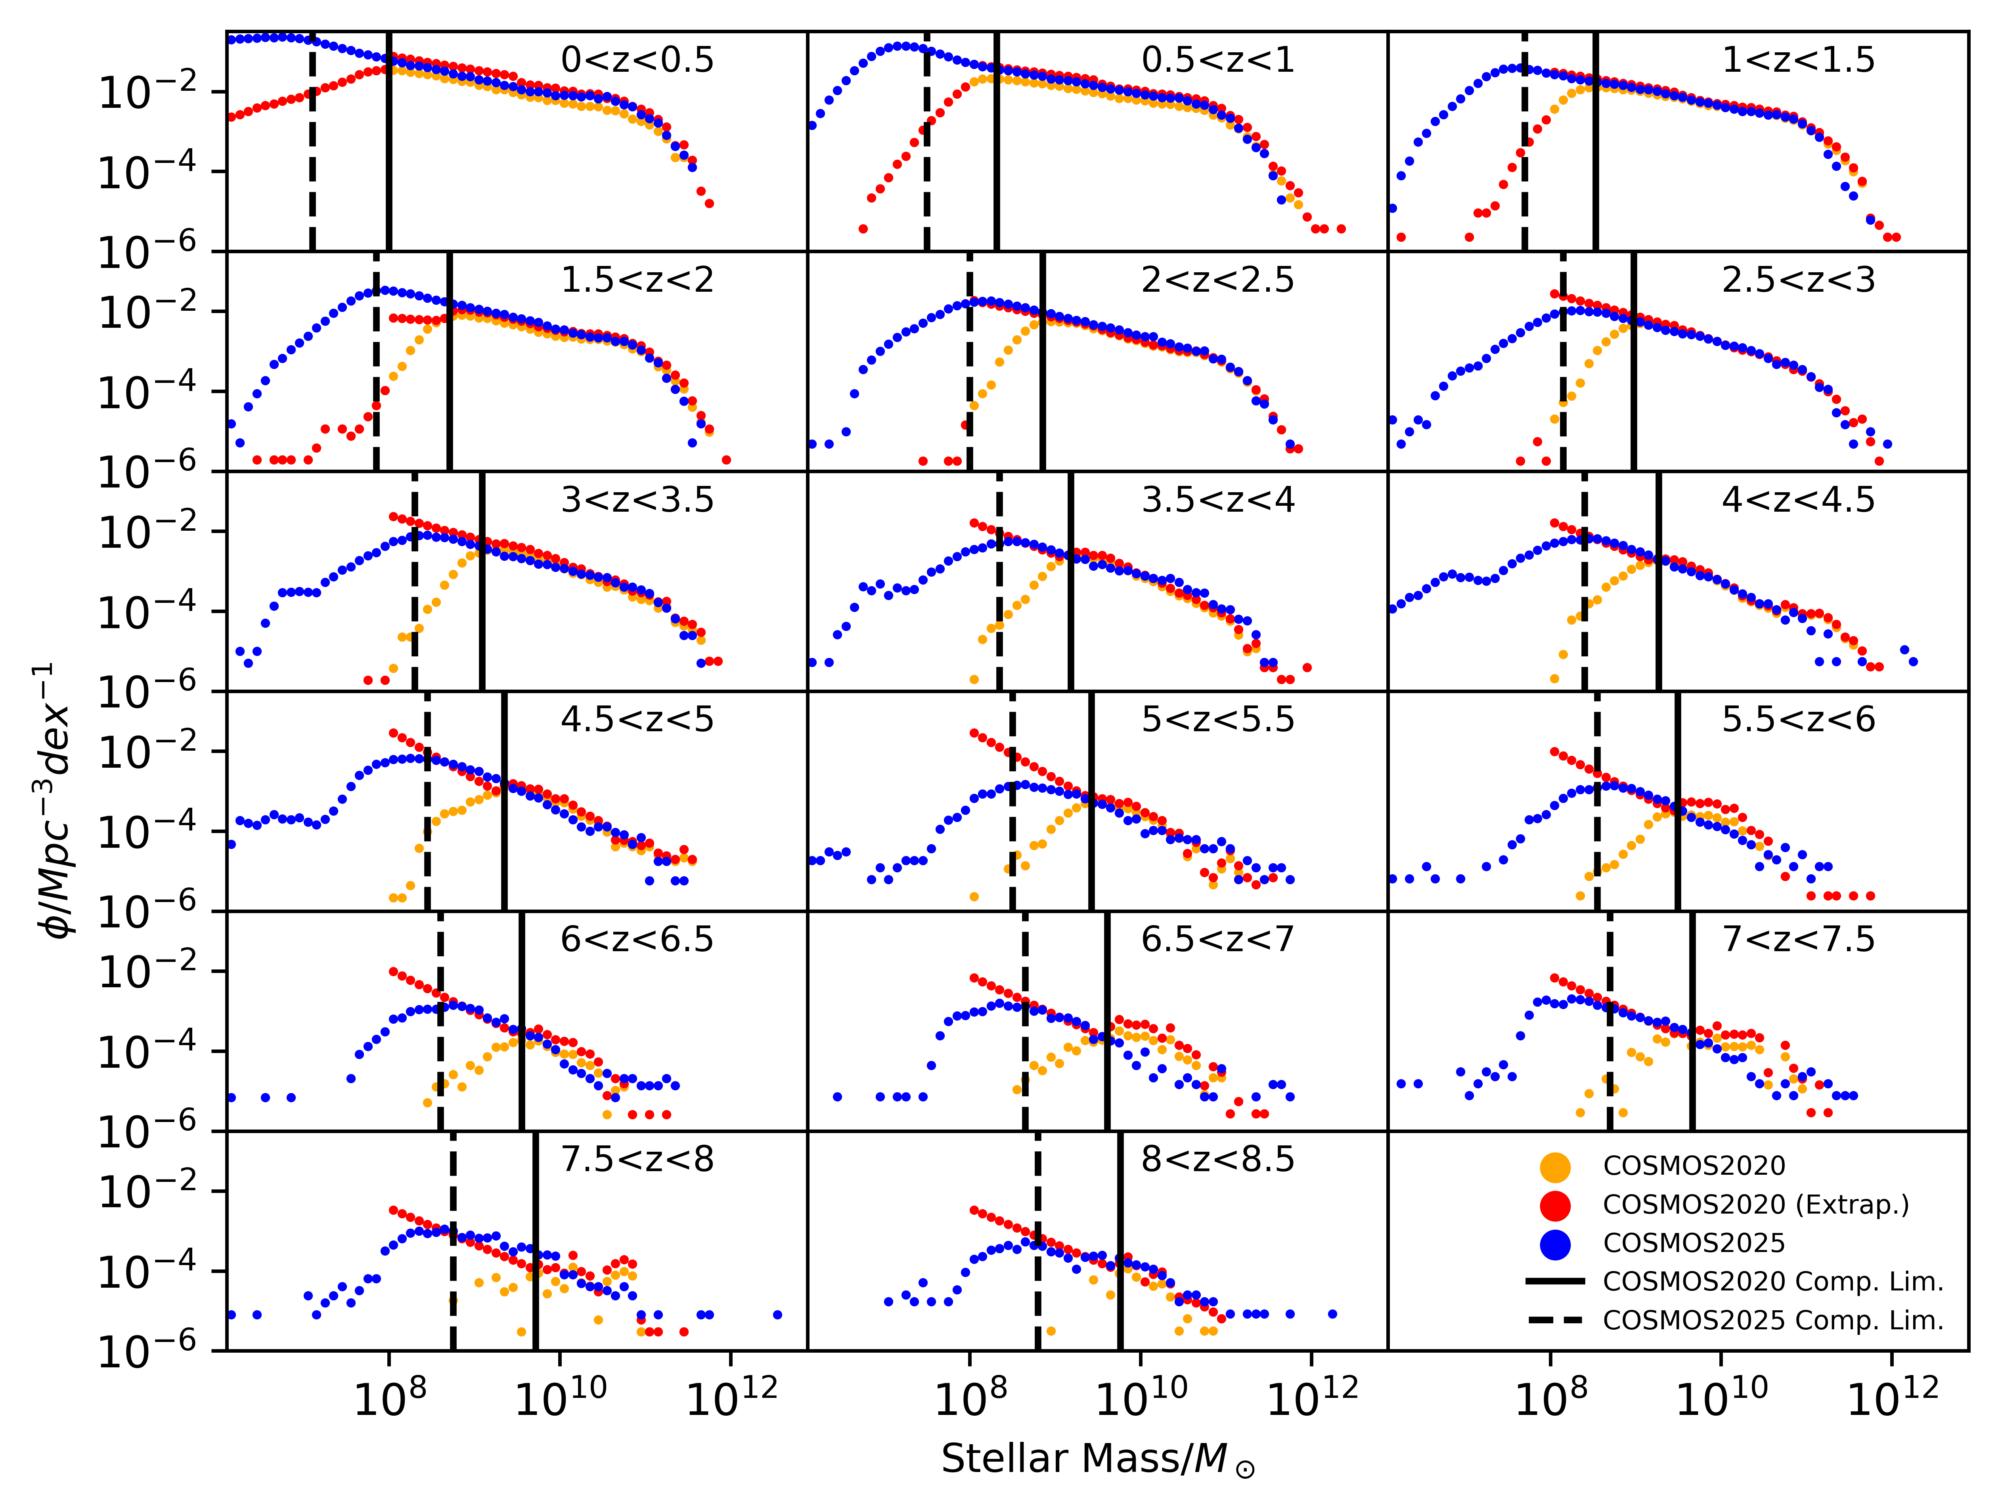
Our simulation catalogues are primarily based on data from COSMOS2020, using HST, Subaru, VISTA and Spitzer data which covers a 1.44deg² range up to z = 10. However, this data has known incompleteness at the low and high redshift ranges, so we must account for it via multiple extrapolation techniques. By calibrating using the in-depth CANDELS subsample, and fitting to the stellar mass function of the sample, we can make samples comparable to the latest JWST data from the COSMOS-Web pencil survey (see figure). From this robust mock catalogue we can test LIM techniques such as masking (see Karoumpis et al 2024, the science highlight 10.25), thereby providing an empirical backing to other simulations and their contaminant removal techniques. This also provides a framework for upcoming cross-correlation work, including cross-instrument cross-correlations, which we will cover later this year.
This work will be submitted to A&A shortly, though it is based on earlier work focussing on [CII] signal (https://doi.org/10.1051/0004-6361/202450300)