Stars form within molecular clouds, dense regions of cold gas primarily composed of molecular hydrogen. These clouds provide the necessary conditions for the formation of stars, including low temperatures and high densities, which allow gravitational forces to overcome thermal pressure and initiate the collapse of gas. To fully understand the process of star formation and therefore the evolution of galaxies, it is crucial to study the properties of molecular clouds—such as their mass, density, distribution, and relation to the galactic environment.
The Physics at High Angular resolution in Nearby GalaxieS (PHANGS) collaboration aims to create a comprehensive view of star formation and the lifecycle of gas and dust in nearby galaxies, using state-of-the-art facilities. In particular, by leveraging the James Webb Space Telescope (JWST)’s infrared capabilities, the PHANGS-JWST program has provided astonishing views of 19 galaxies in wavelengths that are typically obscured by dust in the optical range, reaching unprecedented resolutions and sensitivities.
We used observations of the emission from Polycyclic Aromatic Hydrocarbons (PAHs, e.g. complex organic molecules that emit strongly in the mid-infrared and are associated with photodissociation regions) from PHANGS-JWST to generate molecular gas maps of the 19 galaxies.
The application of the Spectral Clustering for Molecular Emission Segmentation (SCIMES) on the JWST data allowed the identification of more than 50,000 highly-resolved molecular clouds. SCIMES is a machine learning-based code that utilises graph theory concepts to segment out molecular clouds from the more diffuse medium by preserving their intrinsic morphology and internal structure.
Our preliminary results suggest that the molecular cloud mass spectra—specifically their steepness and truncation mass—are strongly influenced by the surrounding dynamical environment. This indicates that certain physical conditions may be more favourable to the formation of high-mass clouds than others.
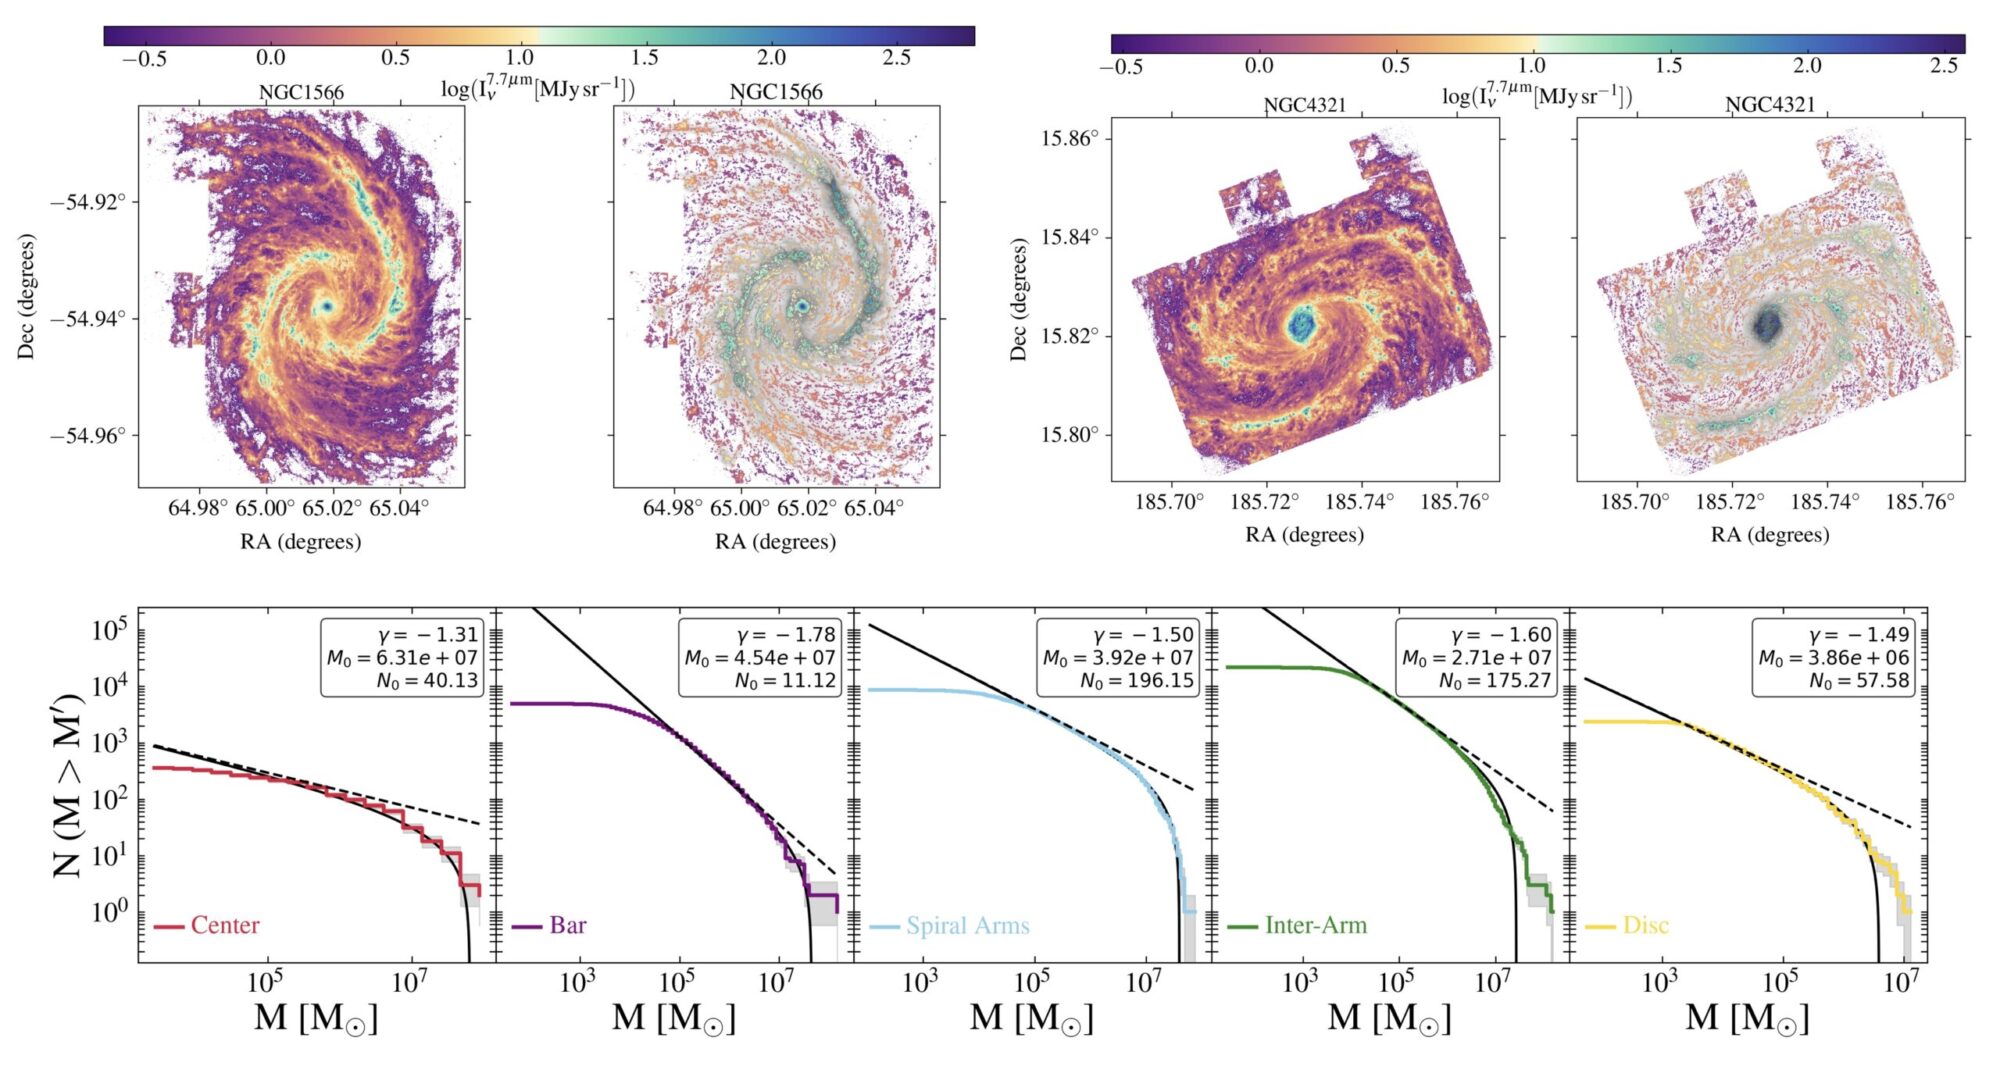
Figure caption: Upper row: Left image shows the galaxy’s intensity map; right image displays dust structures identified by SCIMES with a greyscale intensity background and a colour bar indicating 7.7 μm intensity. Bottom row: Cumulative mass distributions of molecular clouds in different environments. Dotted black lines represent simple power-law fits; solid black curves are truncated power-law fits. Fit parameters—γ (spectral index), M0 (maximum mass), N0 (count in the distribution). The grey region represents the Poisson errors on the counts.