We analyze molecules in the laboratory to find their spectroscopic “fingerprints”, which astronomers can use to identify the molecules in space. Unlike a human fingerprint, the molecular fingerprint also reveals physical properties of the molecules’ surroundings. The temperature of the astronomical regions can be determined by comparing the relative intensities of different transitions of a molecule. In an ideal case, the transitions belong to different vibrationally excited states of the molecule. Therefore, analyzing also the rotational spectra of vibrationally excited states, the so-called vibrational satellites, in the laboratory is important. However, due to the higher vibrational energy, their population usually is very much lower compared to the ground vibrational state making it harder to find their patterns in the spectrum.
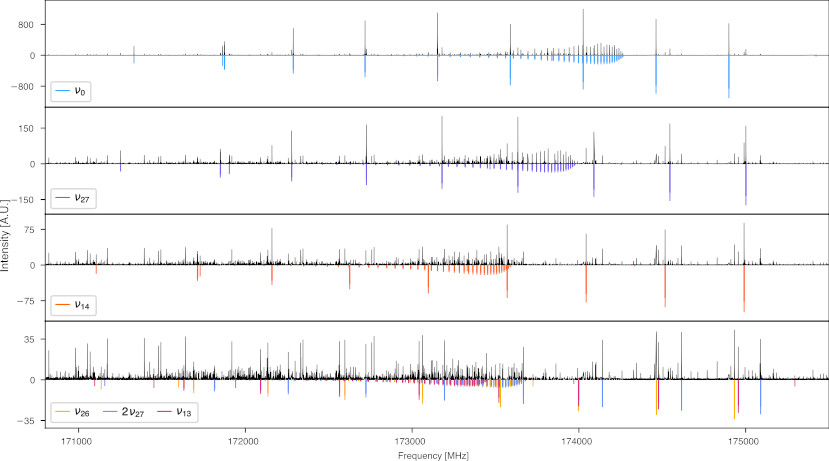
The figure shows a small part of the rotational spectrum of cyclopentadiene. The top row shows the predictions for the ground vibrational state in blue and the experimental data in black (maximum intensity of 800 A.U.). Going to the second row, all experimental data around the ground state predictions are removed to highlight the weaker pattern (maximum intensity of only 150 A.U.) of the vibrational state v27 with the corresponding predictions being shown in purple. Similarly, rows three and four show the spectrum after additionally removing the lines corresponding to v27 and v14, respectively.
Unfortunately, a few experimental lines are missing in the last two rows as they are blended with lines of already removed states. Nonetheless, this procedure greatly facilitates the identification of vibrational satellite spectra and nicely highlights their different intensities.