In recent years, the fine-structure line of C+ at 158 microns – the [CII] line – has gained significant attention as a molecular gas tracer, particularly at z ≳ 4. Being one of the brightest emission lines in galaxies, it offers a unique window into the molecular ISM of distant galaxies, where conventional tracers like CO become observationally expensive.
We have tested the reliability of this line as a tracer of the molecular gas mass (Mmol) using a statistical sample of galaxies at different cosmic epochs from high-resolution cosmological simulations – the Marigold simulations. Our analysis reveals that the [CII]- Mmol correlation is relatively weak at z ≳ 5, but becomes progressively stronger over time. We also identify a clear secondary dependence on the star formation rate (SFR), accounting for which, significantly improves Mₘₒₗ predictions by a factor of 2.3 at all redshifts.
We have further examined the time evolution of the [CII] luminosity function and the cosmic [CII] luminosity density (ρ[CII]) and found that faint (L[CII] < 107 L⊙) galaxies contribute nearly half of the cosmic ρ[CII] at z ≳ 7. Since these faint galaxies fall below the sensitivity limits of current instruments, detecting them would require alternative observational strategies.
The paper describing our findings has been published in A&A.
DOI: 10.1051/0004-6361/202453048
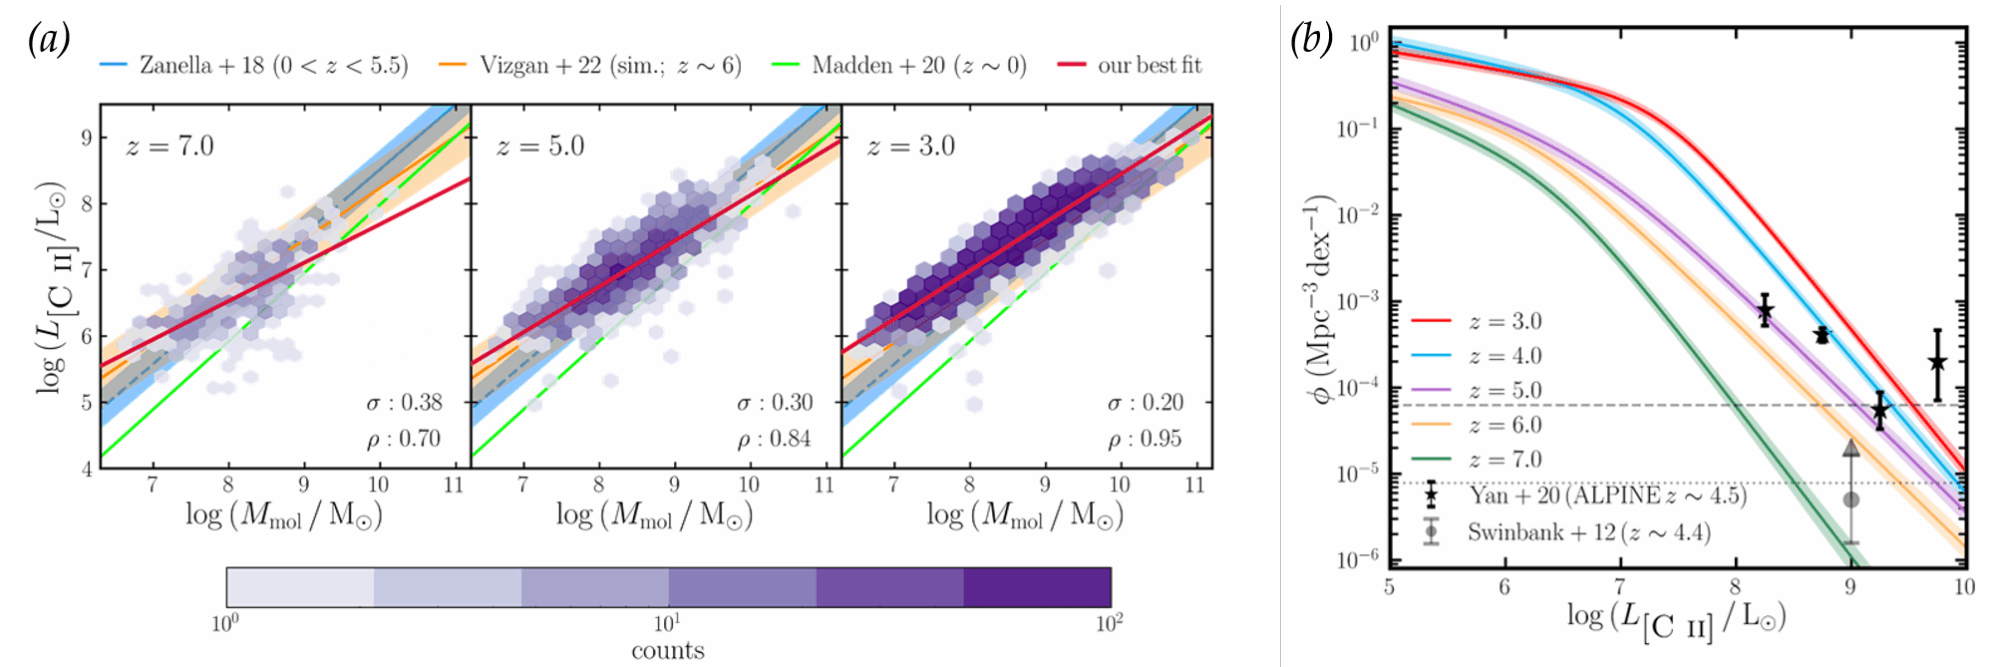
Figure caption: a) Figure showing the redshift-evolution of the [CII]-Mmol relation in galaxies from the Marigoldsimulations. The purple bins show the distribution of simulated galaxies and the red line gives the ordinary least squares linear fit to these galaxies. The blue, lime, and orange lines show previous empirical and numerical estimates for specific redshifts. We note that the [CII]-Mmol correlation tightens and strengthens over time, as indicated by the decreasing scatter (σ) and increasing Spearman’s rank correlation coefficient (ρ) towards lower redshifts.
b) Figure showing the redshift-evolution of the simulated [CII] luminosity function (LF) and a comparison with observational estimates (in black). The coloured lines represent the best-fit double power-law to the simulated LF and the shaded area represents the central 68% credibility range obtained using MCMC chains.