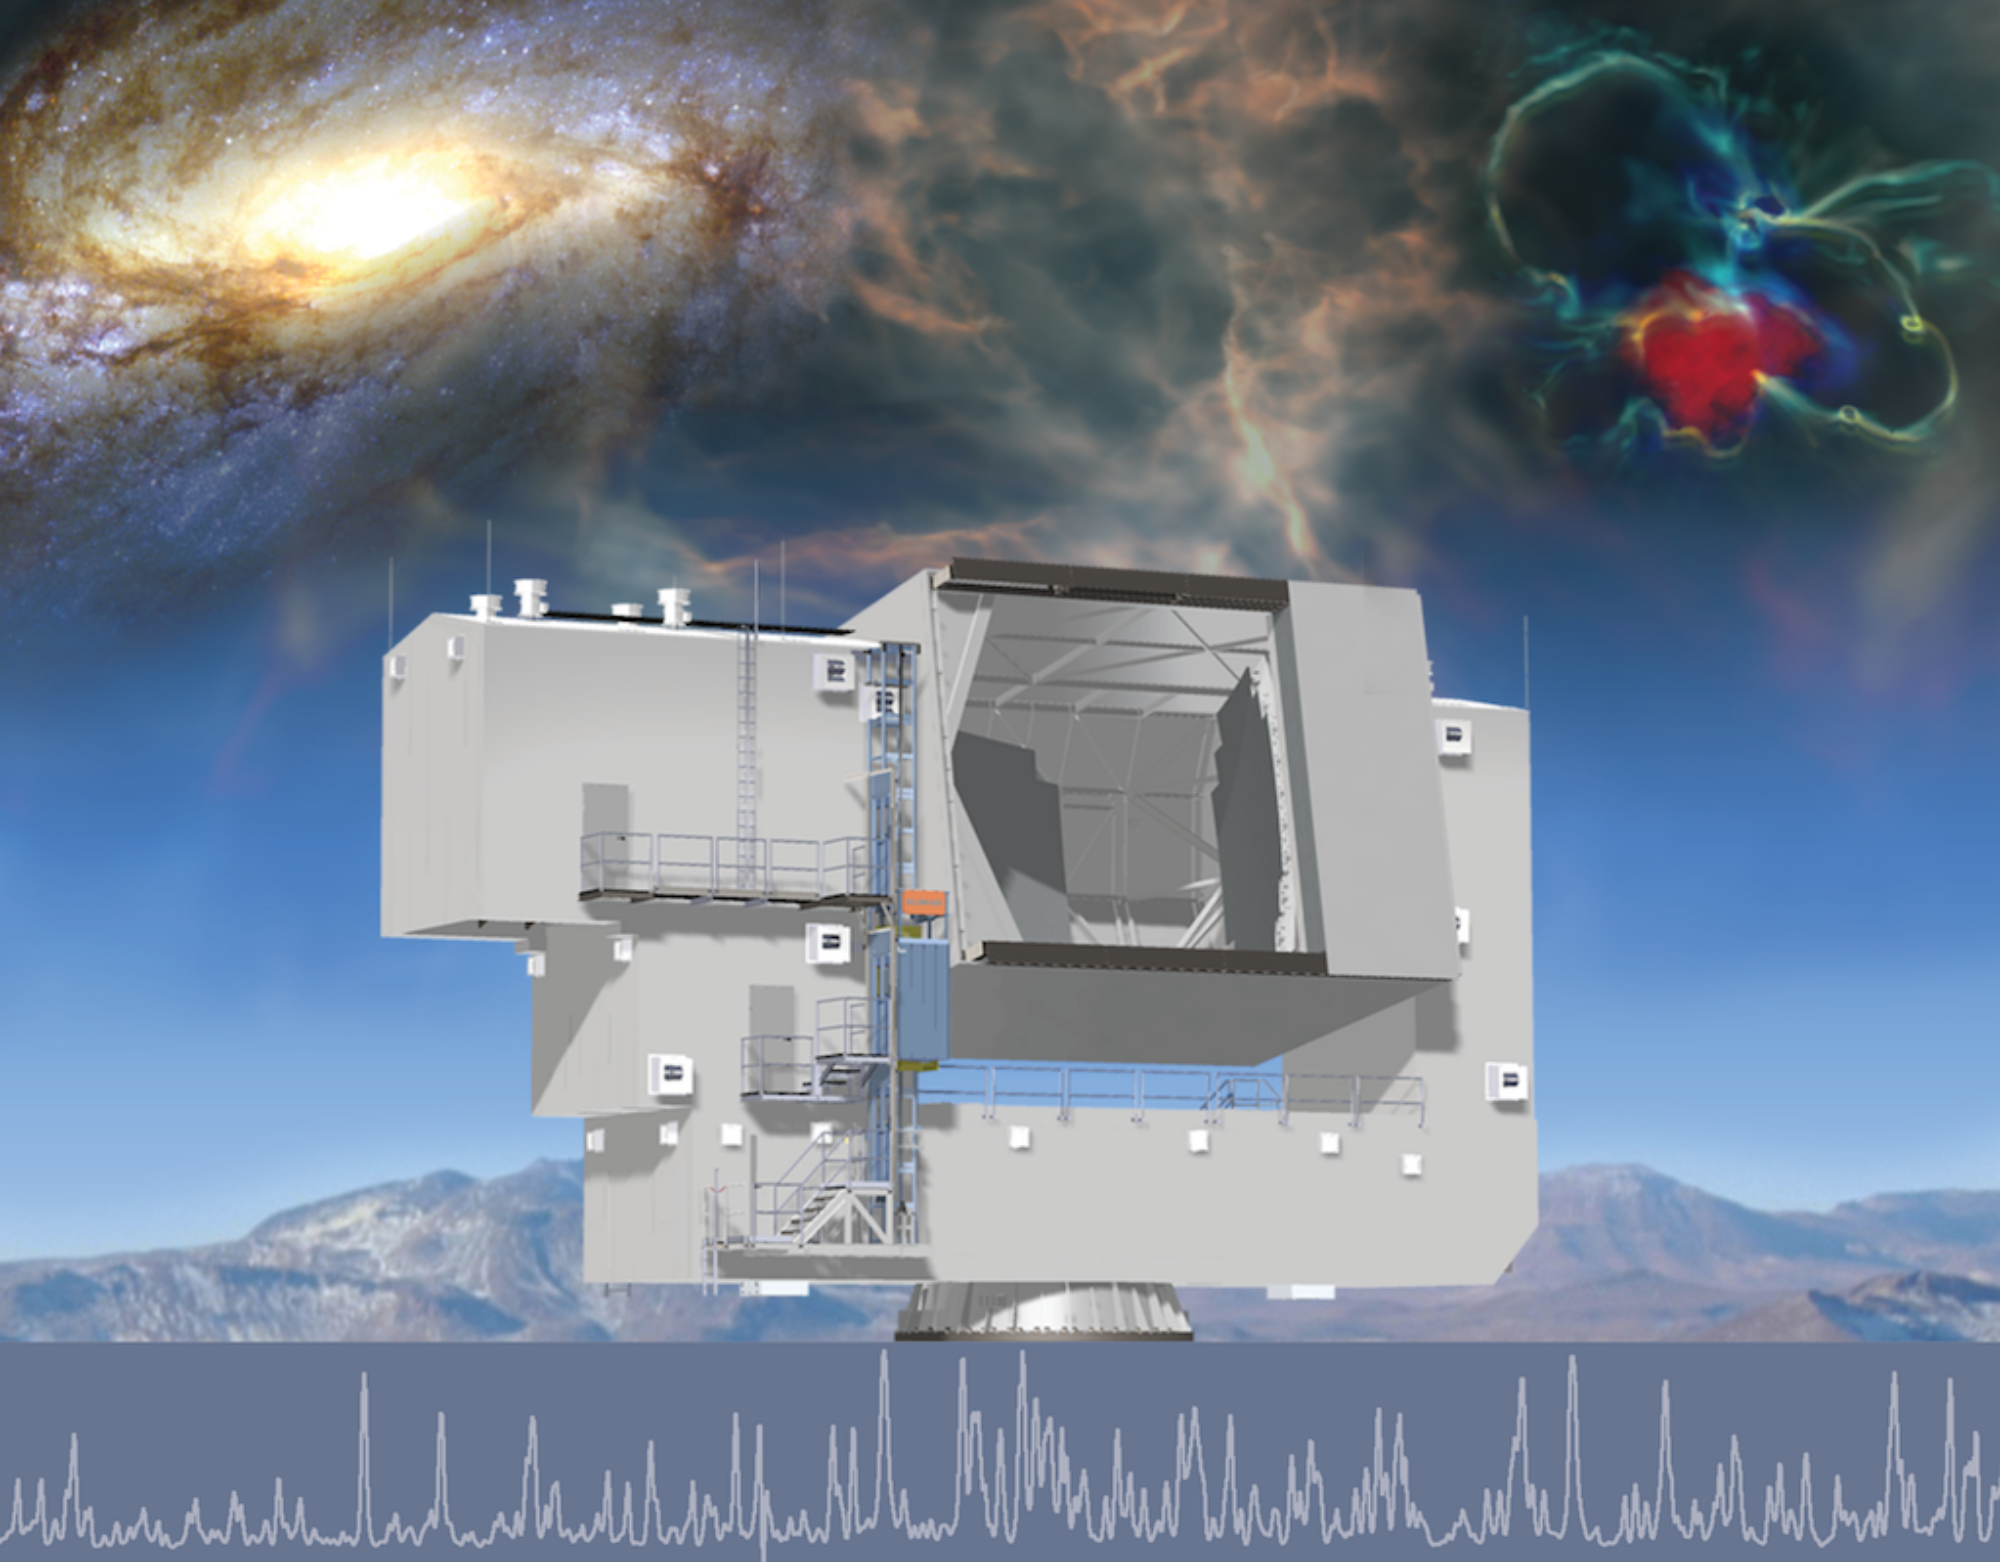
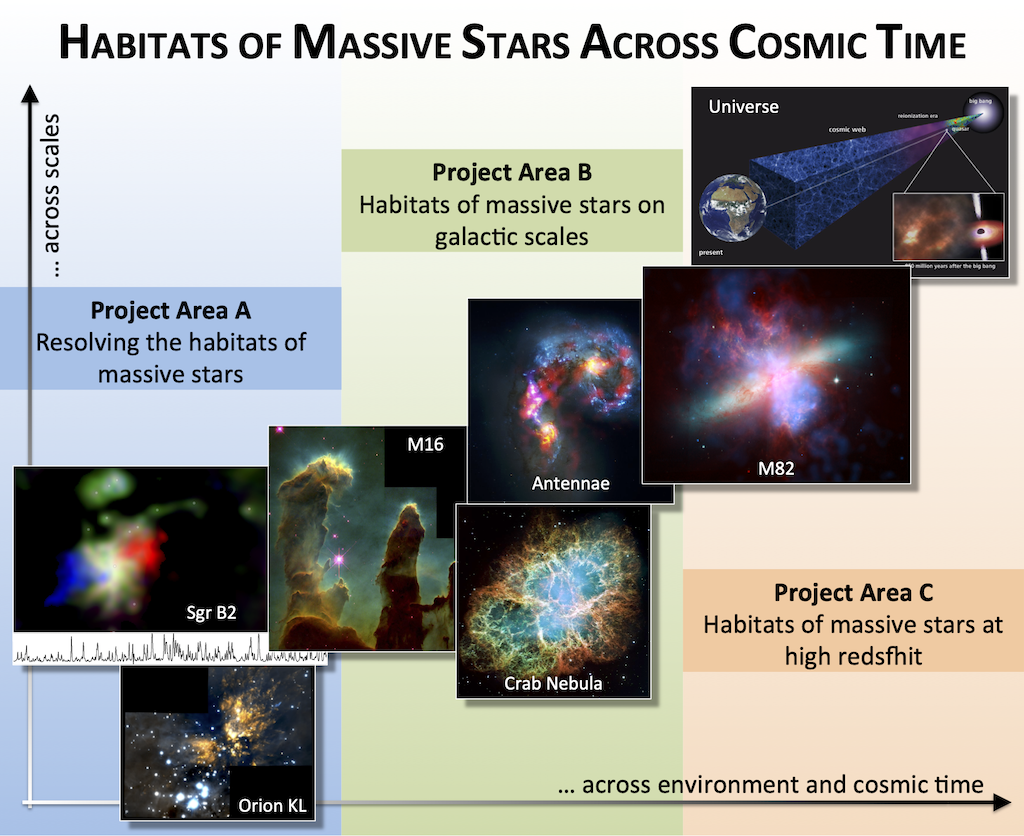
Massive stars, due to their short lifetime and high energy output, drive the evolution of galaxies across cosmic time. Hence, they substantially contribute to shaping the present-day Universe. The Collaborative Research Centre (CRC) will unravel the “habitats of massive stars across cosmic time”. “Habitats” are the gaseous environments within which massive stars are born and which they interact with via their feedback. Over the anticipated 12-year lifetime of this new CRC initiative, we aim to connect the physical processes that govern the habitats of massive stars across the full range of environments hosting massive stars – from sub-parsec to mega-parsec scales and from the Milky Way to the high-redshift Universe, where massive stars leave their cosmological fingerprint by driving cosmic reionisation.
Key Profile Area
“Dynamics of the Universe”
Our universe is full of fascinating, mysterious and often surprising phenomena. Understanding and explaining this in physical terms is the task of the new key profile area Dynamics of the Universe.
The Dynamics of the Universe key profile area establishes an excellent environment for training, early contact with current research, and exchange in international co-operations and competitions. In addition, the interdisciplinary collaboration between the fields of physics, computer science and applied mathematics will be strengthened in the long term. This is particularly important given the need to meet unprecedented challenges arising from the large amounts of observational data being generated by way of innovative ideas and algorithms, and to enable and efficiently advance complex simulations using new hardware technologies.
SFB 1601 News

Public Outreach
Symposium 2026
HRMS 2025

Colloquium
Child Care
Publications

Videos & Articles
SFB 1601 Projects
PhD Students

Family & Diversity
Sustainability
Science Highlight
-
A3: A faint neighbour beside a supergiant: imaging the candidate companion of Betelgeuse (Emma Bordier)
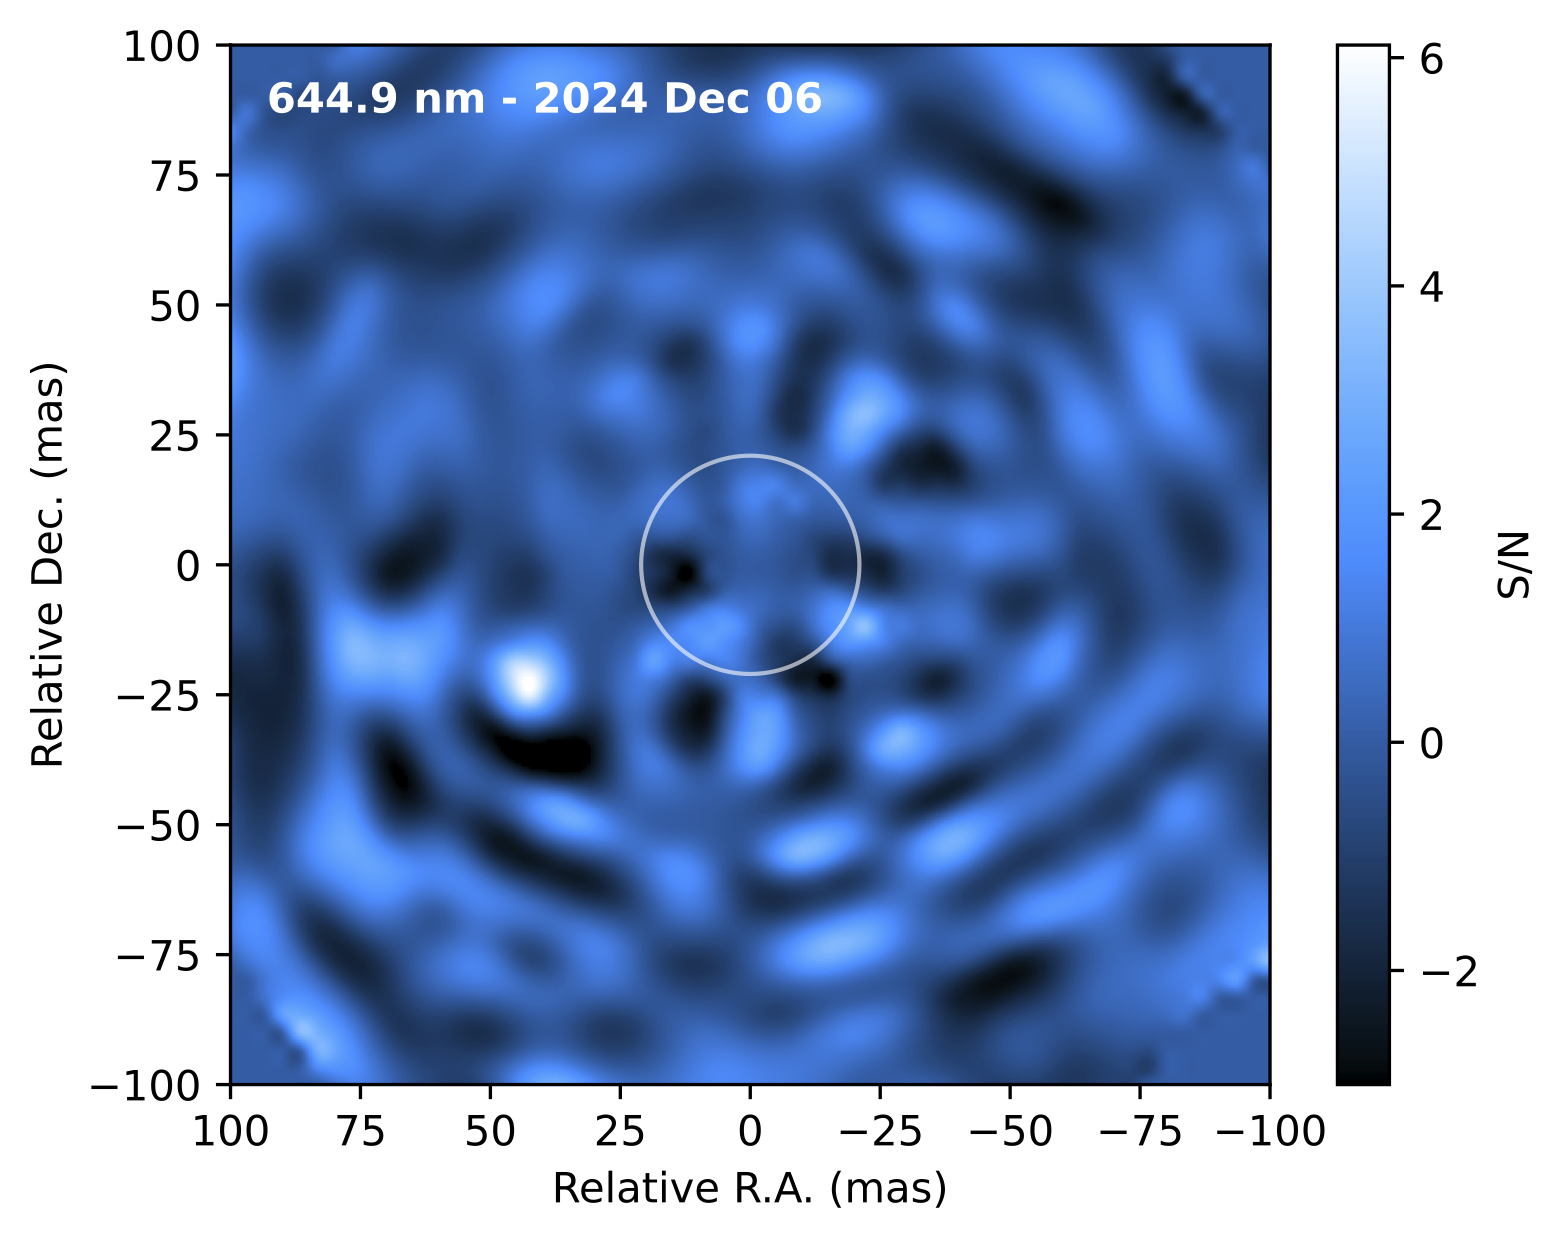
Betelgeuse, the red supergiant marking Orion’s shoulder, has long been suspected, but never confirmed, to host a stellar companion. Using the extreme adaptive-optics instrument SPHERE, in its ZIMPOL imaging mode, on ESO’s Very Large Telescope, we have now directly detected a companion star that is about 1,000 times fainter than Betelgeuse, partly explaining why it had remained hidden until now.
We observed Betelgeuse on 3 and 6 December 2024, timed to the predicted maximum apparent separation of a hypothetical companion inferred from a reinterpretation of the star’s ~2200-day “long secondary period” (LSP) brightness cycle. Processing the angular and spectral differential imaging data with the PACO ASDI algorithm, we detected a point source in the continuum-Hα filter at 6.1σ, independently recovered at ~5σ with principal component analysis. The source sits at a separation of 52.32 ± 0.18 mas and position angle 117.12 ± 0.60°, corresponding to a projected distance of ~8.8 au at the asteroseismic distance of 168 pc, comparable to Saturn’s orbit around the Sun, and implying a minimum orbital period of 5.5–5.9 years, consistent with the LSP.
Fitting the source’s continuum flux against pre-main-sequence PHOENIX model atmospheres, and assuming coevality with the 8–10.5 Myr-old Betelgeuse A, favours a 2.6–3.1 M⊙ star of spectral type B8.5V–B9.5V that has just reached the main sequence. Non-detection in narrow-Hα, together with the absence of UV and X-ray signatures reported elsewhere, disfavours a pre-main-sequence interpretation.
These results corroborate a tentative 1.5σ detection reported by Howell et al. 2025 (using Gemini North Telescope in Hawaiʻi), and strengthen the case that Betelgeuse’s LSP traces orbital motion rather than pulsation alone; estimates of dust sublimation around the companion suggest this mechanism alone cannot account for the full LSP amplitude, favouring a dynamical origin instead. Confirming Betelgeuse B as gravitationally bound, rather than a chance alignment, will require a second astrometric epoch near opposite orbital phase, motivating continued high-contrast monitoring of this benchmark red supergiant.
This teamwork was led by Miguel Montargès (LIRA, Observatoire de Paris), with Emma Bordier (SFB 1601) among the co-authors; it is published in Astronomy & Astrophysics (https://www.aanda.org/articles/aa/full_html/2026/07/aa61023-26/aa61023-26.html), and was the subject of press releases from ESO (https://www.eso.org/public/news/eso2611/) and the University of Cologne (https://uni-koeln.de/en/university/news/news/news-detail/beteigeuze-hat-einen-partnerstern-astronominnen-liefern-den-bislang-ueberzeugendsten-beweis).
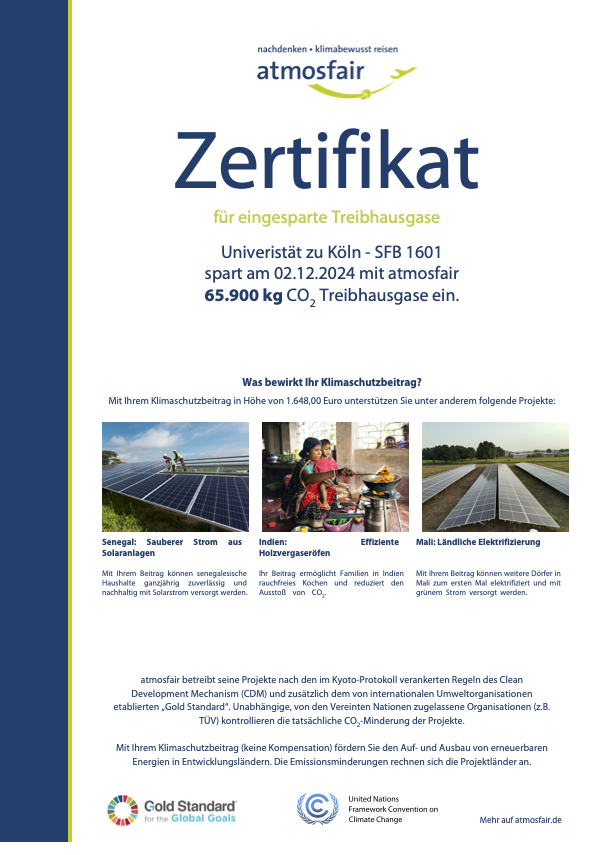
We value our Planet:
1st funding period: 10/2023 – 06/2027